Store and Query Data with InfluxDB
InfluxDB time-stamps and stores your IoT sensor data locally and provides a convenient querying environment. No manifest definition is required! Moreover, its ability to set retention policy allows automatic deletion of expired data without your intervention.
This tutorial will take you fewer than 20 minutes to complete.
Installing InfluxDB
apt install influxdb
systemctl enable influxdb
You'll be using default ports as follows.
-
admin service port
:8083to access the GUI CLI through a Web browser -
Port
:8086to write or query the database through a Web REST API.
You can change these values and others in the /etc/influxdb/influxdb.conf file.
Accessing InfluxDB – GUI CLI
Running systemctl enable influxdb just once sets up the InfuxDB service to run at every startup. Check it using:
systemctl status influxdb
Access the service from a Web browser running on a different machine using the same network router:
http://_ip_address_:8083
Our tutorial below uses this remote access CLI method first, then shows how to do the same thing using the curl command. You can also use the CLI method directly on your ARTIK board (if you have Firefox installed).
Follow the steps below, which parallel the Influx tutorial, and you'll quickly be making database entries using the GUI CLI.
Create database
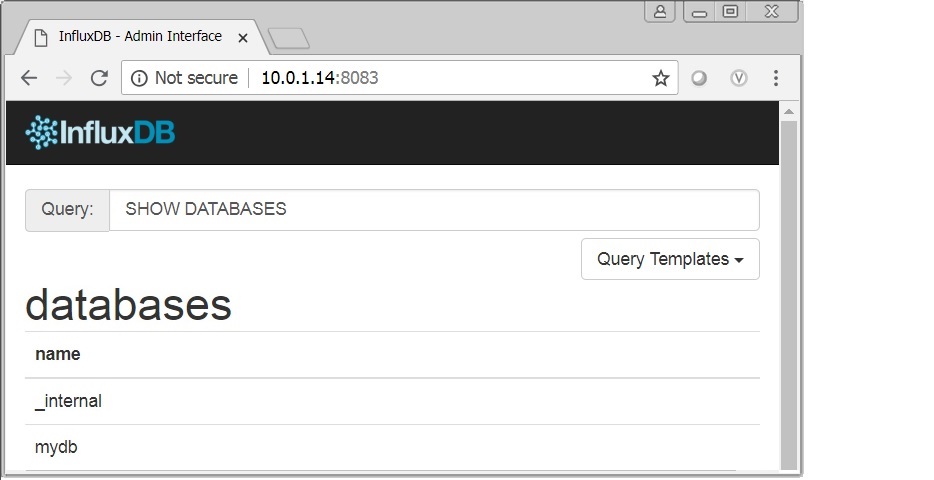
Enter CREATE DATABASE mydb to create your test database.

Entering SHOW DATABASES then returns your newly created one and the default internal one.
Write data
Writing data using the GUI CLI is slightly different than what the online documentation describes for the terminal-based CLI. Here you won't use the INSERT keyword.
In this example, a sensor value is being stored. cpu is the measurement name, value is the measured sensor value, and host and region are associated tags.
-
Select the Database pull-down menu and choose 'mydb'.
-
Click on the Write Data button.
-
In the Write Data box, enter the data only.
cpu,host=serverA,region=us_west value=0.64 -
Click Send Data.

Query data
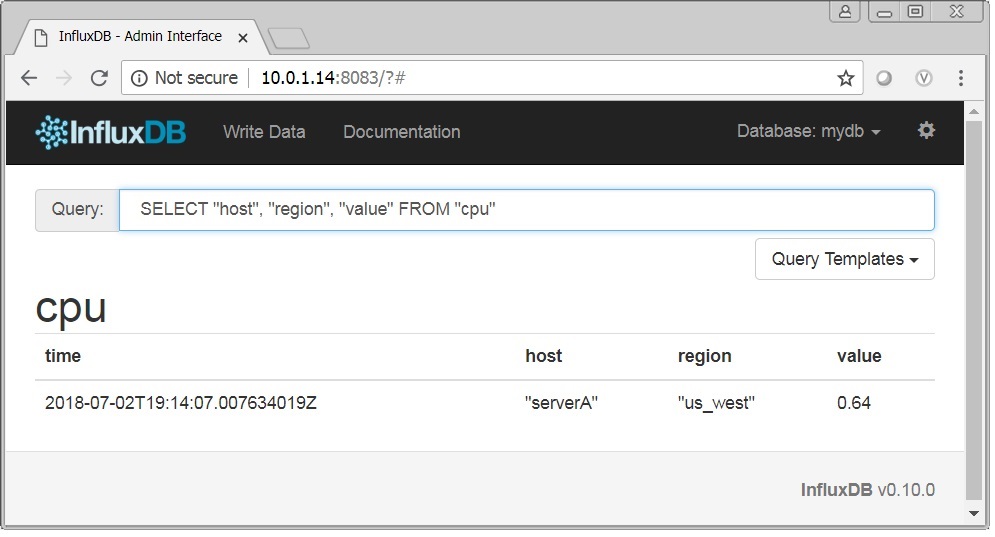
Enter the Query parameters to retrieve your stored data, automatically time-stamped.
SELECT "host", "region", "value" FROM "cpu"
Accessing InfluxDB – REST API
The InfluxDB REST API access method is more convenient to program with than the CLI. In many cases, you'll use a combination of methods to access your Influx database.
-
Application code reads local sensor values, then writes the data to the Influx database using local REST API calls.
-
Users like yourself use the GUI CLI to query the database remotely, with no specific application required (just a Web browser).
-
Remote application code seeking to query data sends commands using the REST API.
Note that the default InfluxDB REST API port is :8086.
Query data
Having learned how to query data using the GUI CLI, you'll appreciate how easy it is to do the same thing using the REST API. It follows the command line format from the Influx query example. Just copy and paste the line below into your terminal emulator.
curl -G 'http://localhost:8086/query?pretty=true' --data-urlencode "db=mydb" --data-urlencode "q=SELECT \"value\" FROM \"cpu\" "
You should see results similar to those below.
{
    "results": [
        {
            "series": [
                {
                    "name": "cpu",
                    "columns": [
                        "time",
                        "value"
                    ],
                    "values": [
                        [
                            "2018-07-02T19:14:07.007634019Z",
                            0.64
                        ]
                    ]
                }
            ]
        }
    ]
}
Write data
Your ARTIK board sensor management application will likely use the local REST API interface (as opposed to the CLI) to write data to your InfluxDB database. Use the code example here to add another data point.
curl -i -XPOST 'http://localhost:8086/write?db=mydb' --data-binary 'cpu,host=server01,region=us-west value=138.9876'
Now repeat the Query data exercise to verify that the data was added.